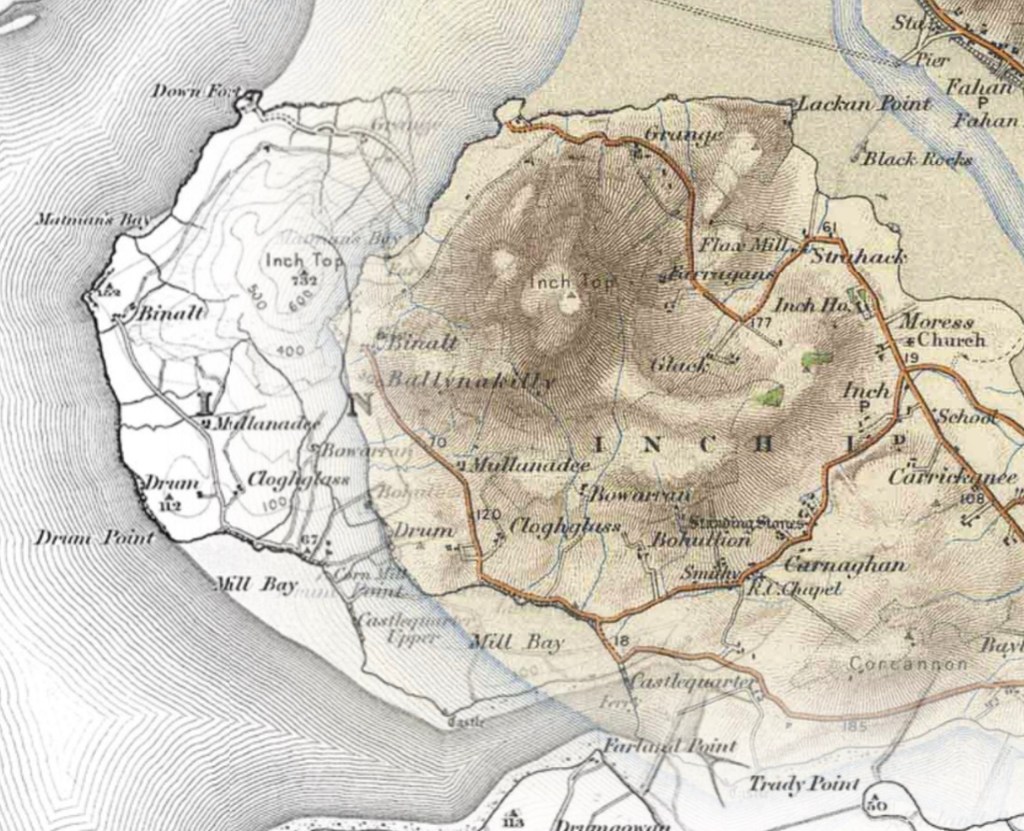
How contours transformed the map from art into measurement.
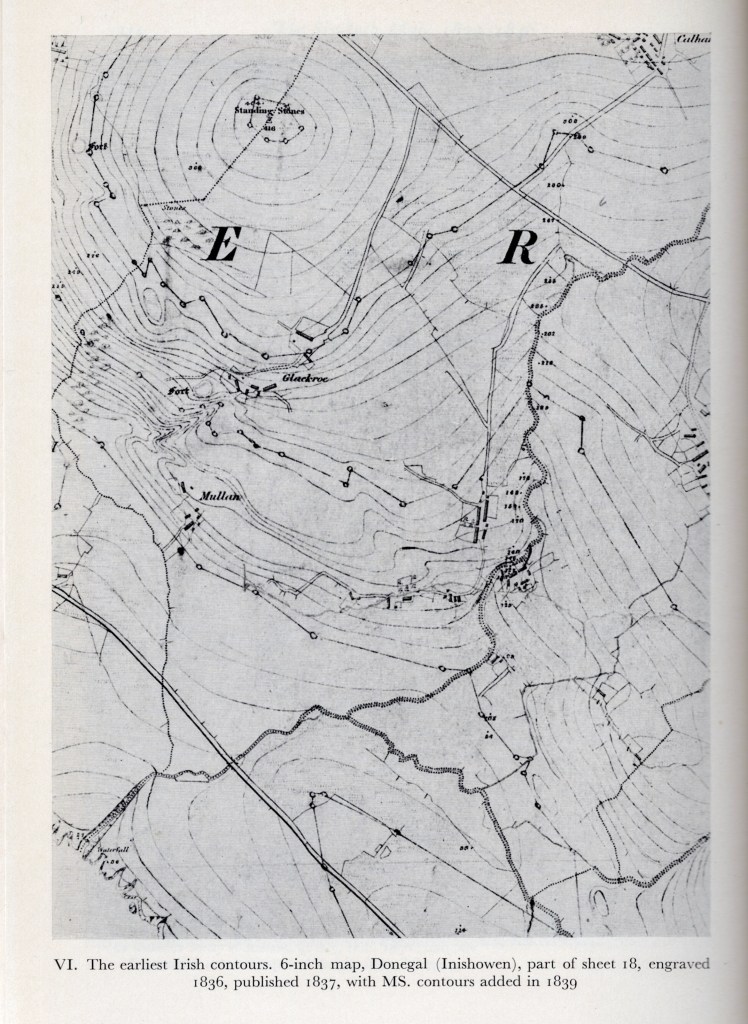
On a small hill in a remote corner of Donegal, towards the end of the 1830s, the soldier surveyors appeared to walk around in circles. They followed the hill rather than crossed it. They pursued a path that curved around ridges, disappeared into hollows, and re-emerged elsewhere, carrying a staff with numbers on it, marking the ground with pegs as they went, dragging their chains behind them. To anyone watching, their behaviour must have seemed peculiar. They were tracing an imaginary contour across the hillside, following points that shared the same elevation. The hills of the Inishowen peninsula had become a testing ground for new ways of depicting the shape of the land. [i]
The triangulation had already fixed the hills’ positions. Chains had carried measurement across townlands, roads, and boundaries. Spirit levelling had established a national framework of benchmarks. But one challenge remained unresolved. How should the shape of the land itself appear on the map?
A paper map constrains the cartographer to two dimensions. It could show where a mountain stood without explaining its form. It could trace the river at the bottom of the valley without revealing the depth of the valley or the steepness of its sides. Ireland had been measured horizontally; how should it be depicted vertically?
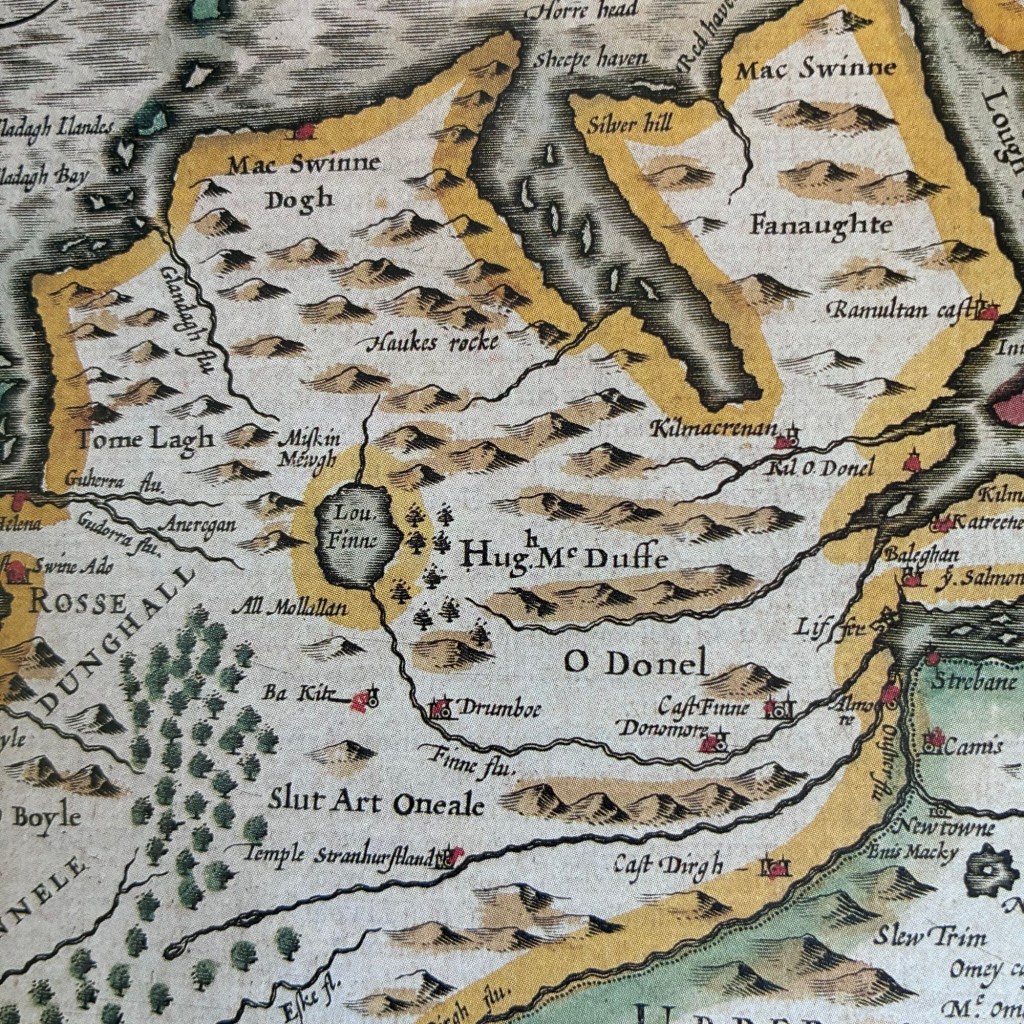
Cartographers had wrestled with this problem for centuries. On the earliest maps, mountains rose from the page as miniature drawings, more artistic impression than measured landscape. Later came hachures: fine engraved strokes drawn in the direction of the slope, their thickness and density creating the illusion of steepness and form. The results could be strikingly beautiful, but they relied as much on the skill and judgement of the hill sketcher as on measurement, with one depicting a hillside quite differently from another. Hachures conveyed the appearance of relief rather than its precise form, and the lines that suggested the shape of the land often obscured other details on the map.
The surveyors sought something more systematic, more suitable for an industrial and scientific age that increasingly demanded maps that engineers could measure rather than merely admire. Roads, drainage schemes, and, above all, railways, demanded reliable information about height and gradient. Relief had to become quantifiable.
Spirit levelling provided an essential foundation. Benchmarks established along roads and cut into bridges, churches, walls, and gateposts created a vertical framework extending across the country. Once heights could be established consistently, surveyors could then represent terrain mathematically.
Contours had already been used in Europe and offered a solution. Rather than sketching the appearance of a hill, they connected points along a line of equal height above sea level. Every point along a contour line occupied precisely the same elevation. Close contours indicated steep slopes; widely spaced contours suggested gentler ground. For engineers and surveyors, they conveyed something hachures never could: measurable heights and gradients.
The Ordnance Survey did not invent contours, but their systematic adoption in Ireland owed much to Thomas Larcom. French military engineers had long used contouring for military plans, but as a member of the Parliamentary Commission on Irish Railways (1836–37), he understood that railways demanded accurate gradients, something hachures could never provide. Under him, the Survey turned the hills of Inishowen into a laboratory to try the method. [ii]
The surveying of contours was laborious work. First the surveyor established a point at the required elevation from a nearby benchmark or trigonometrical station. Pickets were then placed at that height across the ground. The survey party chased the contour around the land, following an invisible line across hillsides, bogs, valleys, and ridges. Unlike chain surveying, where lines could often be forced directly across the ground, contours followed the logic of the land itself, twisting around slopes, vanishing into marshland, crossing streams, and reappearing elsewhere. The surveyor no longer imposed geometry upon the landscape. Instead, he pursued the geometry already present within it.
Concentric contour rings first appeared on the six-inch map sheets around Mullagharry Hill, in Donegal. The results impressed both Colby and the Board of Ordnance, and specimens were sent to Chatham for use in instructing Royal Engineer cadets. [iii] A local experiment in Donegal was becoming a new language of cartography, and from about 1840 in Ireland, and a few years later in Great Britain, hill sketching was increasingly based on surveyed contours. [iv]
The new method was not universally welcomed. During the 1850s Parliamentary committees questioned whether contours justified their additional cost and whether traditional hachuring provided a better representation of the hills. The debate exposed two competing philosophies of cartography. Should a map portray how the land appears, or should it measure its form with scientific precision? The Ordnance Survey’s leaders, supported by engineers, argued that contours “compel the truth to be given…”. Parliament ultimately endorsed their use, allowing contours to become a standard feature of British and Irish maps. [v]
Hachures did not disappear overnight. On the smaller-scale one-inch maps, specialist hill sketchers continued to record the character of the terrain into shaded representations of relief. For many years, the one-inch map was published in two versions, one with hachures the other with contours. One offered immediate visual impression; the other supplied measured information. Increasingly, the hachures themselves were based upon the contours, as art gave way to measurement.
Contours transformed the visual character of maps. Hills, valleys, ridges and escarpments ceased to be decorative features. They became part of a measurable system capable of supporting engineering, administration, military planning and scientific analysis. The map was no longer just an illustrated landscape but an abstract model of the terrain.
Yet that apparent objectivity concealed one of the enduring realities of map-making: every feature on it represented a choice. The selection of contour intervals determined what detail became visible and what disappeared. Slopes were reduced to discrete vertical steps: fifty feet, one hundred feet, or some other interval. The ground itself remained continuous; the map imposed classification and abstraction upon it.
That tension runs throughout the history of the Survey. Boundaries became lines on the map. Names were interpreted and standardised. Heights became contours. The Survey transformed topographic complexity into a coherent geographical system that could be measured, analysed and understood. The achievement lay not simply in recording Ireland as it appeared, but in creating a scientific model of the country itself. The curious surveyors who had appeared to wander across a Donegal hillside had helped create a new language for depicting the landscape.
By the middle of the nineteenth century, the map itself had changed, no longer merely a collection of roads, rivers and boundaries. Through triangulation, boundary survey, chains, place-name collection, levelling and contours, Ireland had become a unified geographical system. It was surveyed, classified, known and increasingly permanent. The map no longer simply described the land. It quantified it, modelled it and preserved it.
One further challenge, however, remained. The map captured the topography at a moment in time, but as Ireland changed, the map would have to change with it. The Survey had learned how to measure and represent the landscape in three dimensions. It would now have to learn how to keep the national map current over time.
[to be explored in the next post: “Perpetuating the Survey”]
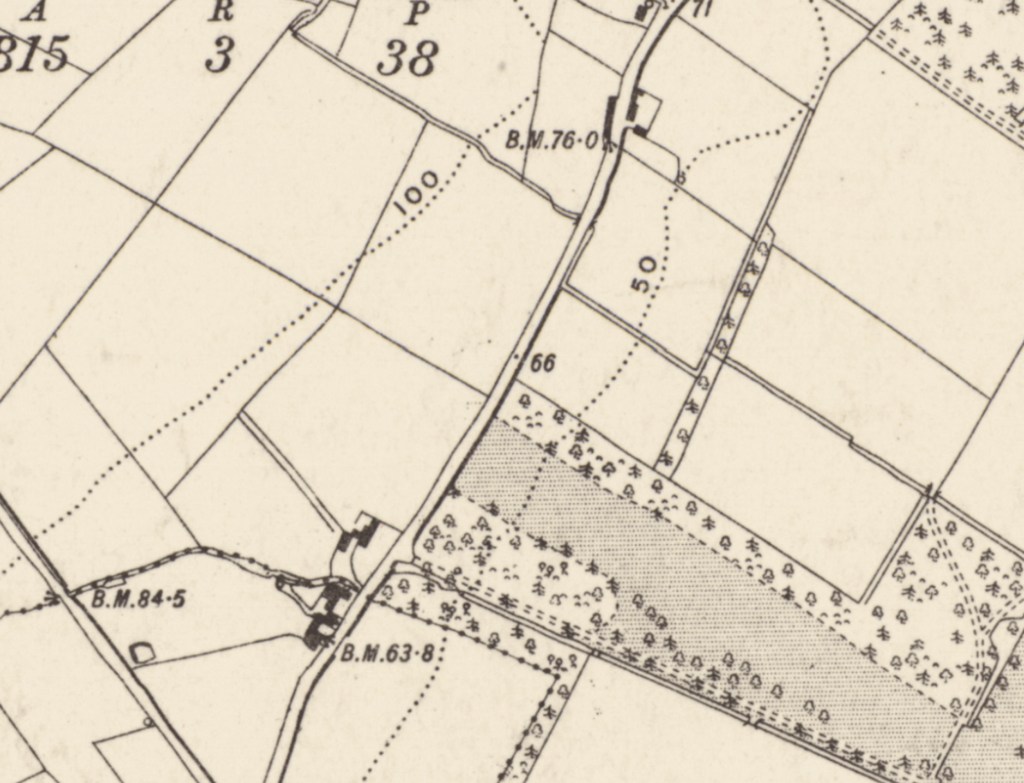
Published 1904 from surveys between 1830 and 1899
CC BY-NC-ND 4.0
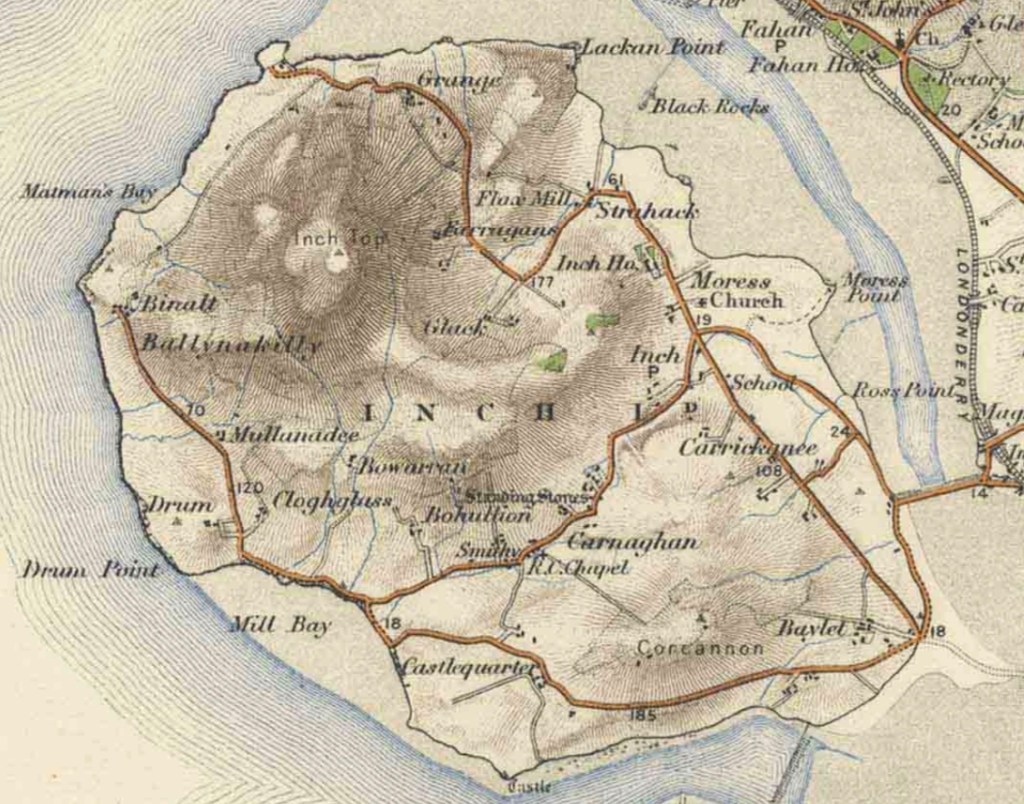
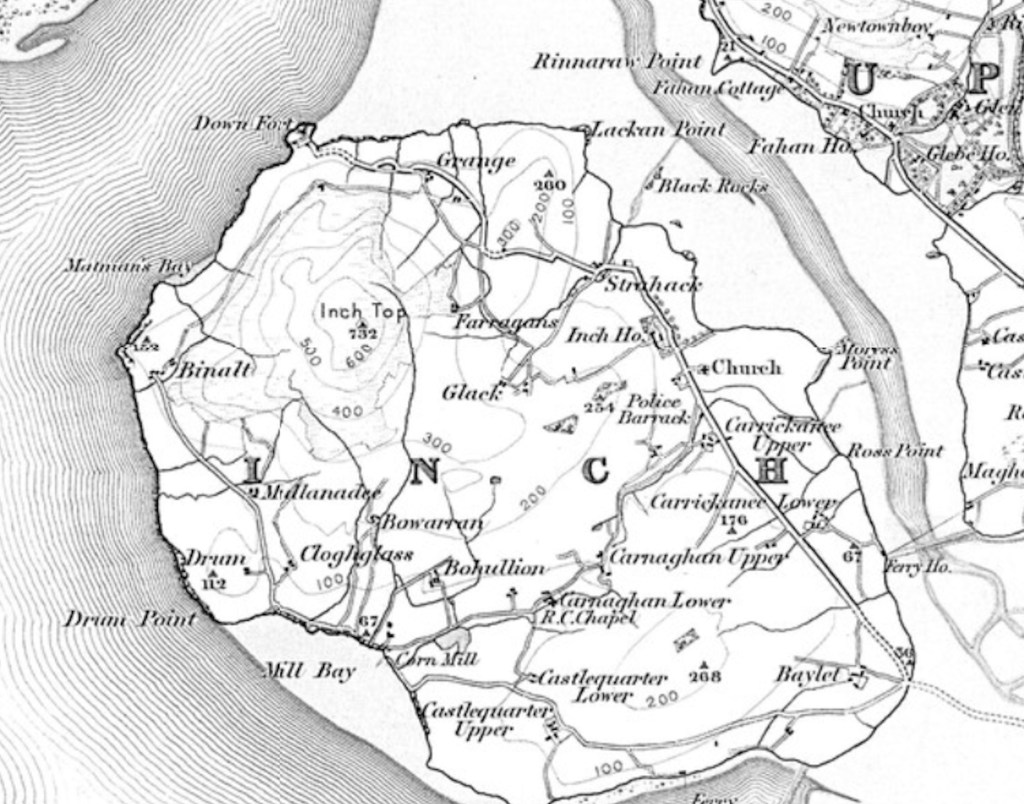
Published 1904 from surveys between 1830 and 1899
Footnotes
Header Image- map images courtesy of the National Library of Scotland. Reuse by CC_BY (NLS). See https://maps.nls.uk/
[i] Rann, Karen. Making History in County Donegal. Sheetlines, Charles Close Society, 130, August 2024, pp21-26.
[ii] Larcom’s contemporary notes reveal that the Survey experimented extensively with alternative methods of depicting relief. These included inked field sketches, brush-and-pencil hill drawings, horizontal hachures, close contours, layered shading, and even raised relief. Many of these trials took place between 1824 and 1847 before contouring emerged as the preferred technique. The experiments demonstrated that the Survey was actively seeking the most effective way to portray the shape of the land. [Seymour (ed), History of the Ordnance Survey, pp 149-153. Close, The Early Years of the Ordnance Survey, pp 142-144]
[iii] Contours were particularly useful in a military context, “where the relative command of ground is most important” Quote from Larcom in Close, p142.
[iv] One curiosity occurred as a result of the change in datum from local to national. The first contours in Donegal had been surveyed from a local low-water mark nearby, on the Donegal coast, and only after the survey work had been completed, was Poolbeg Lighthouse in Dublin Bay adopted as the national height datum. The two reference levels likely differed by about seven feet. Rather than completely resurveying the maps already contoured, the survey adopted a practical solution that preserved an otherwise accurate map and so early editions of the six-inch maps in County Donegal showed contours that were seven feet higher than elsewhere in Ireland.
There is no contemporary source for this explanation, but my assumption is backed up by perhaps the most concise explanation of the oddity appearing in a paper by the Officer Commanding the Survey Company at Phoenix Park in 1955, published in the Engineers Journal, Ireland, entitled “Draggers of the Rope: Ordnance Survey in Ireland, Part III” by “Carthographer” [sic]:
“The discrepancy of seven feet between the County Donegal contours and those of the rest of the country is due to the difference between the level of low water on the Donegal coast, to which the contours in Donegal were referred, and that of low water Dublin Bay (Ordnance Survey Datum), on which the contours for the rest of the country were based.”
[v] Contours were debated as part of the wider “Battle of the Scales” (1851–54), during which Parliament and the Treasury considered the scale, cost and content of national mapping. See Seymour, A History of the Ordnance Survey, pp. 124–129; Owen, Pilbeam, Ordnance Survey: Map Makers to Britain since 1791, pp. 49–60.
By subscribing, you will be notified of new posts.

Response
[…] Position, distance and height became quantities that could be observed, calculated and verified. Contours represented the form of the land objectively, laying the foundations for modern terrain modelling […]
LikeLike