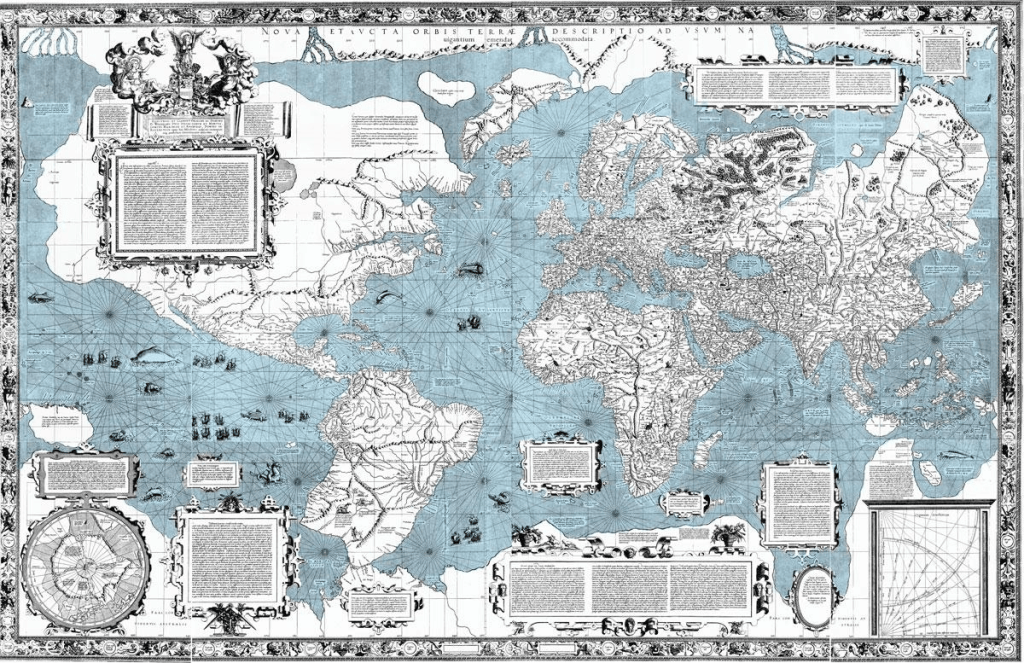
From Columbus’s voyages to Mercator’s revolutionary projection, advances in navigation, measurement and cartography gradually transformed maps from imaginative representations of the world into increasingly accurate geographical records, while exposing the critical problem of determining longitude.
By 1492, Columbus had discovered the New World, based on the mistaken belief that if he sailed west, he would come to the Japanese islands, as reported by Marco Polo. He thought that a degree of longitude was just 83 km long, and that the east-to-west extent of the earth was as depicted by Ptolemy. It was thought that the Asian continent extended farther east than it does, and there was no widespread knowledge of the Americas. After Columbus, the debate about the actual size of the Earth intensified.
In 1528, Jean Fernel, a French physician credited with establishing our understanding of physiology, measured a degree along an arc of the meridian. Using a quadrant to determine latitude and the wheel of his carriage to measure distance, he counted the number of revolutions between Paris and Amiens. His measurement would be within one per cent of the Earth’s size. Fernel abandoned geodesy and cartography for medicine, recognising that in 1530, “…. Pluto, Aristotle and the old philosophers made progress, and Ptolemy added a great deal more. Yet, were one of them to return today, he would find geography changed beyond recognition. A new globe has been given to us by navigators of our time”.
It was Gerhard Kräner who brought this new globe. Born in Flanders to German parents in 1512, he studied at the University of Leuven (in modern-day Belgium), where his name is recorded as Gerardus Mercator. After graduation, he made globes, instruments, maps, and charts, as well as surveyed and mapped Flanders. He had been raised Catholic but was sympathetic to Martin Luther’s teachings. After persecution and imprisonment, he moved from Catholic Leuven to Protestant Duisburg in Germany, where he was appointed court cosmographer by Duke Wilhelm of Cleves (brother of Anne of Cleves, the fourth of Henry VIII’s wives). In 1569, he produced a revolutionary map showing the extent of the known world.
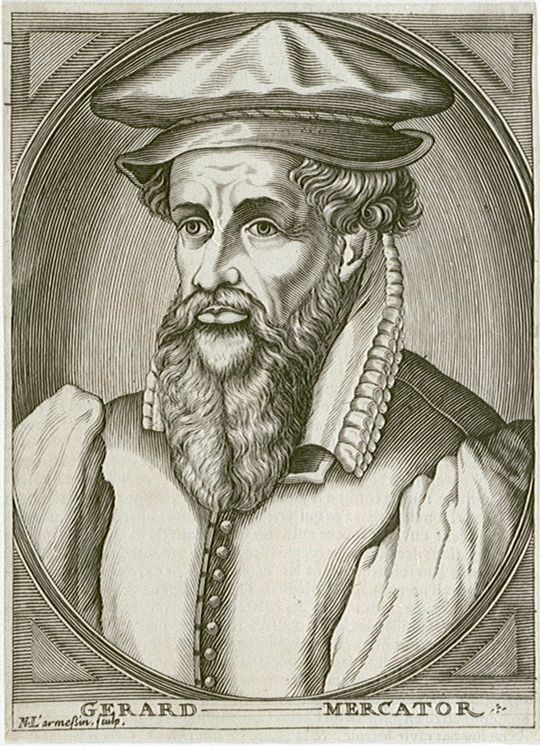
Gerardus Mercator by Nicolas III de Larmessin (1684–1755)[3] – Public Domain, https://commons.wikimedia.org/w/index.php?curid=2481951
It was not Mercator’s map that was significant, but its properties. What was revolutionary was a projection that enabled navigators to plot courses of constant compass bearing as straight lines, profoundly influencing the development of nautical cartography. Lines of latitude and longitude were drawn at right angles, and a line of constant bearing appeared (for the first time) as a straight line on the map, a helpful property when traversing the open seas. His map infamously distorts the land areas away from the equator, so Greenland (for example) appears much larger than Africa, but in reality is only 7% of the African continent’s land area. Only countries in and around the equator are depicted true to size, and distances and areas vary depending on where on the map they are measured.
Conceptually, Mercator’s projection is relatively straightforward. Imagine, if you will, a piece of paper wrapped around the earth, touching the Earth at the equator. Now imagine a light shining from the centre of the Earth, so that the features of the Earth are projected onto the paper permanently. The unrolled paper would then reveal Mercator’s map. Of course, the actual map is a scaled-down version of the imaginary roll of paper. Its important characteristic was that directions around a point remained true, a useful property for navigation. How Mercator arrived at his projection remains unknown, and its mathematics were only developed later by Edward Wright, whose formula required knowledge of the size of the Earth, something that was still not known accurately. [1]
Not all maps around Mercator’s time show latitude and longitude in the margins, although they do begin to show more features and recognisable place names. This shift reflected the early emergence of scientific observation, in which direct measurement and careful scrutiny of the natural world began to supplant inherited authority and imagination. Maps increasingly depicted the real rather than the imagined world, though true locational accuracy remained elusive.
The map of Laurence Nowell (1564) is an early map that showed latitude and longitude and correct place names, with modern places identifiable and more details discernible. For example, on his map ofIreland, Valentia Island can be seen, and its position can be scaled off the map. Robert Lythe surveyed Ireland for his map of c. 1571, but it is unclear how. Historians suggest he gave “graphic form to the information supplied by his guides” and other written, oral or otherwise sketched. [2]
We find a more detailed map with latitudes and longitudes in Jan Baptist Vrient’s “Irlandiae accurate descripto auctore Baptista Boazia” of 1606. It is based on Boazia’s map produced for the Elizabethan Army campaigns in Ireland. We can again locate Valentia Island, for example, at 52.17 degrees north of the equator and 7.58 degrees east of the zero longitude of the Canary Islands, thus 3.4 km further east and 28.75 km south from today’s position. [3] Given that latitude and longitude are marked on the map in graduations of 1/12th of a degree intervals, which is approximately 9.25 km, this is certainly within the tolerance required of that time and would bring a sailing ship to within sight of land in all but the worst of weather, but only if they could accurately determine their location.
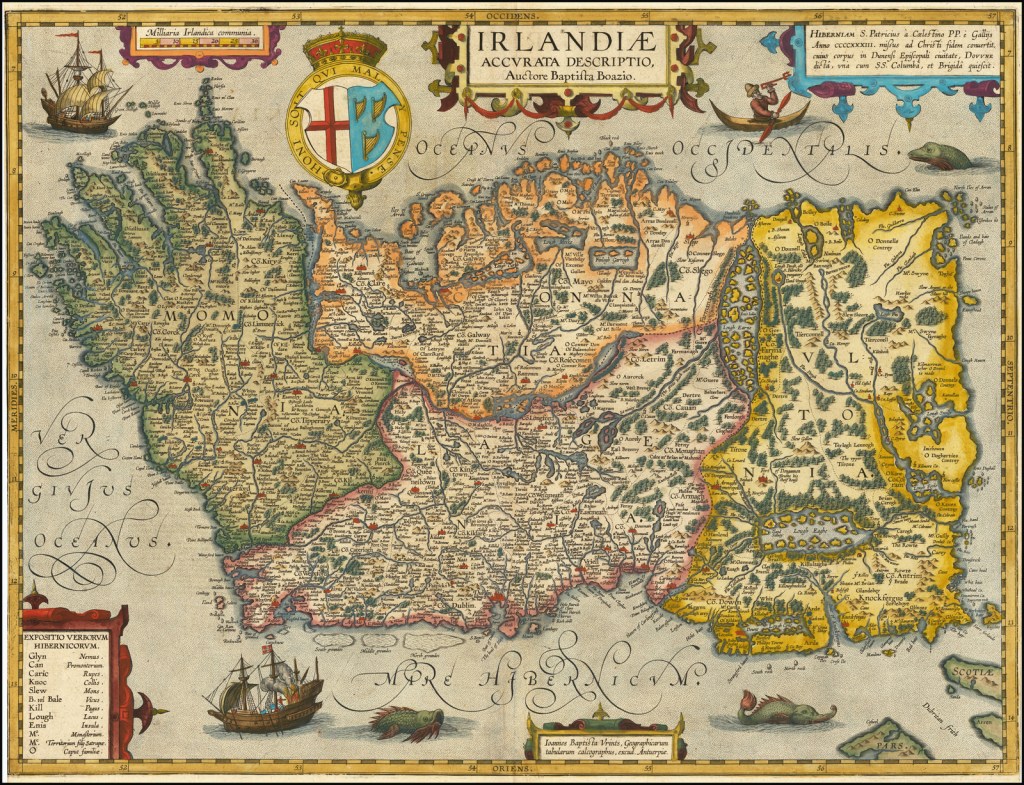
Jan Baptist Vrient’s “Irlandiae accurate descripto auctore Baptista Boazia” of 1606.
Library of Congress, Geography and Map Division.
The uncertainty in determining one’s location led to Great Britain’s greatest naval disaster. This event set the scene for solving the longitude problem: the emergence of the naval chronometer and the use of triangulation across the islands. Triangulation would enable lighthouses, headlands and coastlines to be more accurately positioned, and provide the framework for more reliable maps.
see: The Isles of Scilly
Footnote
Header image shows Gerardus Mercator’s world map of 1569. ISource: Wikimedia Commons, public domain.
[1] “Certain Errors in Navigations”, by Edward Wright, 1599.
[2] “Shapes of Ireland. Maps and their makers 1564 – 1839” J H Andrews Geography Publications 1997.
[3] Correcting for the location of the Canary Islands.
